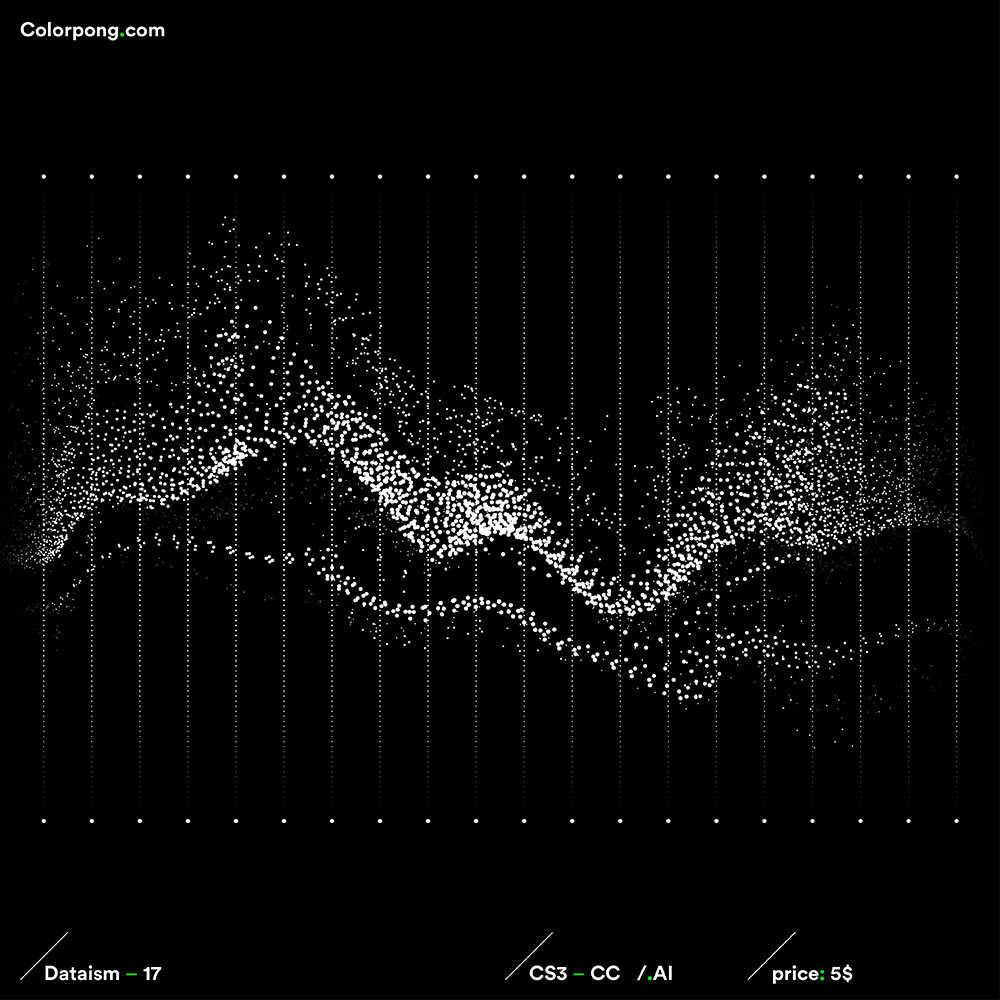
I’m working on a project where something similar to this (maybe even animated) would fit perfectly, but I don’t know how to create something similar (I want to create mountain shapes or buildings that may resemble a chart or levels)
Even though the example you posted says .ai at the bottom, I suspect that means Illustrator can open it and work with the file rather than implying that the designer created it in Illustrator.
I have no way of knowing, but data visualization software is helpful for creating similar kinds of graphics. This software’s primary purpose is to display numerical data graphically, but plugging in phony data to achieve various artistic effects seems doable.
I suspect you were looking for something simpler, though. Unfortunately, I don’t think there’s an easy button for this.
Yes, I figured out that it isn’t only a button, but I didn’t expect coding from scratch. Thanks anyway, I’m trying to find a starting point for this like some documentation. But if I won’t, I will do it manually or end up buying the pack and customizing it myself.