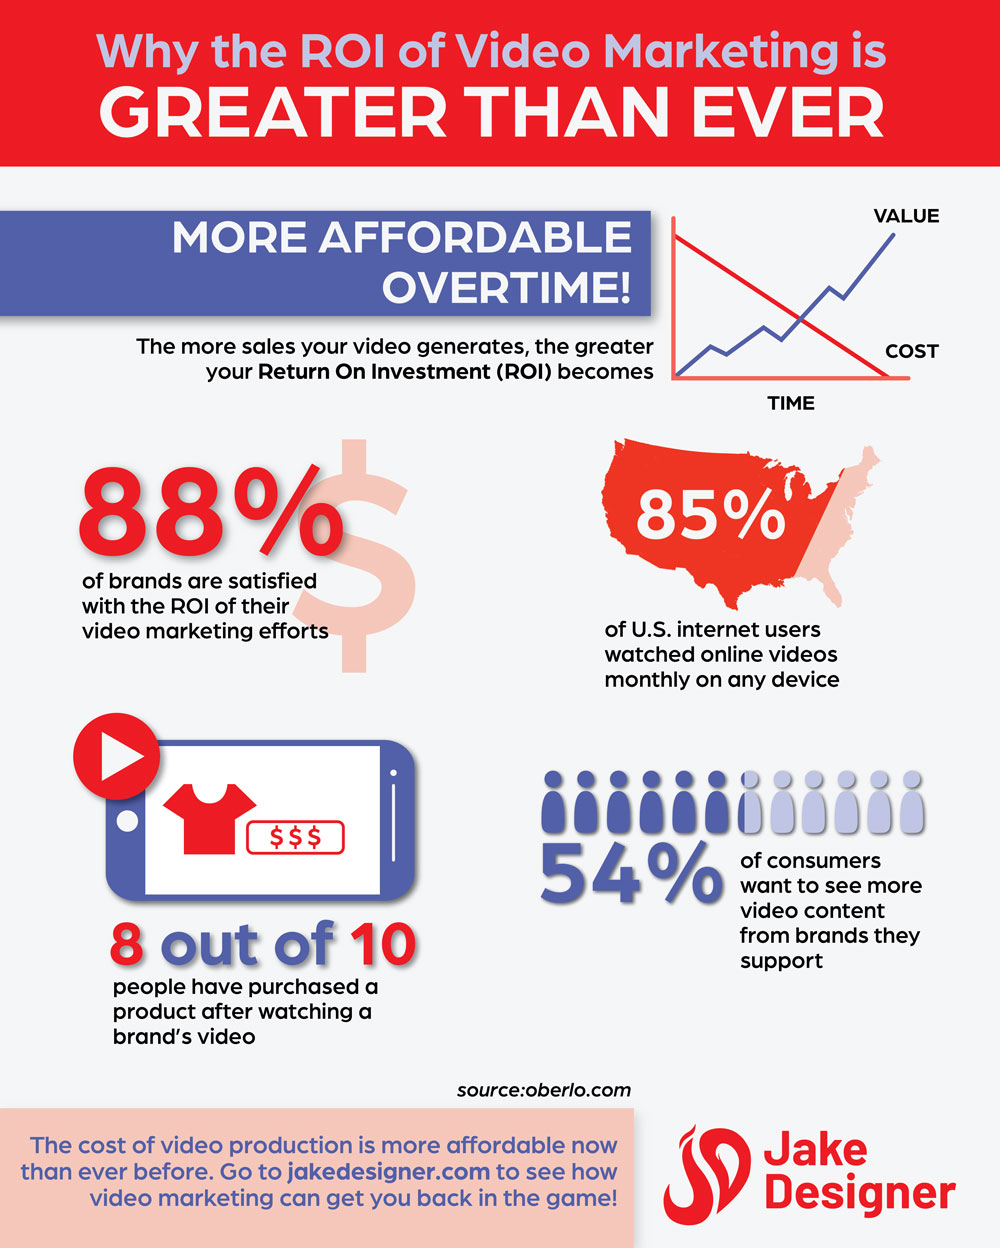
Hi all! Recently, I made an infographic on the return on investment of video marketing. It basically explains how it’s worth investing in video marketing for one’s brand or business. I plan on making an animated version of this, so any feedback is welcome :).
The headline seems a bit awkward in that it’s long, emphasizes a supporting phrase as the main point, and jumps directly into the subject without, first, clearly establishing what the subject is. It took me a moment to figure out the graphic was about marketing with videos instead of marketing videos themselves, and that was only after I took two or three seconds to remember what ROI meant.
Use of the phrase “Greater Than Ever” on a red background might have some unintended political overtones in the U.S. — especially when used as part of a red, white and blue color scheme in an election year.
Overtime is two words unless you’re referring to working overtime.
Your chart shows the relative cost of video over time declining on a steady slide from expensive to free.
Your call to action — driving people to your website — appears to be fine print rather than an important, concluding part of the message.
I think the statistics you’re presenting make a convincing argument for using video to market products and services, but I’m not so sure you’ve made it entirely obvious at first glance what you’re selling.
1 Like
The 8 out of 10 people purchasing a product after watching a brand video seems insanely high. If that’s the case, TV or video advertising would be all any brands would need practically.
I’m assuming that the stat is more along the lines of 8 out of 10 people have at one time purchased a product or service as a result of a brand’s video. Even that isn’t super clear. Bottom line is I assume the stat is that 80% of people have been influenced to purchase something through a brand video at some point in their life. Your stat currently as is sounds as if 80% of the time that people see a video that they purchase that brand’s product or services which would be practically impossible.
Heck, car companies alone would love that. And based on how many car video ads I’ve seen, I can assure you I haven’t purchased 80% of their vehicles due to their video advertising.
From a design standpoint, there doesn’t seem to be much of a grid, it all seems a little loose. Also, the top two stats are all red, the 3rd stat is a mix of red and blue, and the last is all blue. The blue on pink text is harder to read due to lower contrast. All in all, the info is good, but IMO it needs to be all in all tightened up.
Oh, and the drop shadows just make everything a little less sharp and muddies things up. Case in point, the 85% of US internet users graphic has no drop shadows and is sharp and crisp.
Just my 2 cents.
2 Likes
I took one look at that.
TLDR